
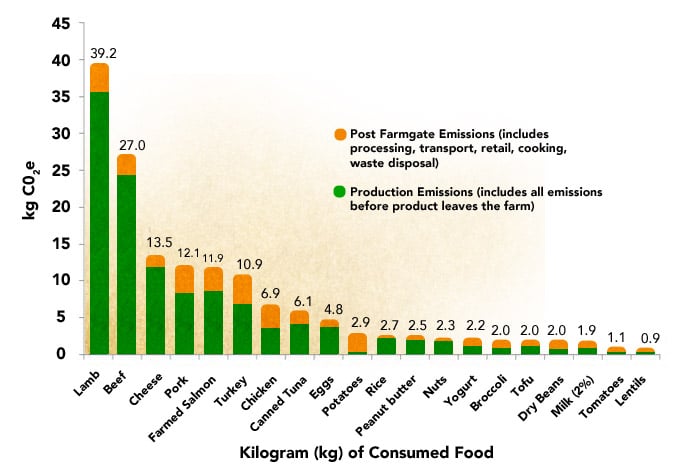
Environmental Working Group: The chart shows the lifecycle total of greenhouse gas emissions for common protein foods and vegetables, expressed as kilograms (kg) of carbon dioxide equivalents (CO2e) per kg of consumed product. We compared our production emissions data for the main meat proteins to several mostly peer-reviewed or government-sponsored studies in the U.S. and Europe that assessed greenhouse gas emissions from animal production systems. Only a handful of other studies showed lower emissions, and these were within 25 percent of EWG’s figures, indicating that our results may be conservative.
If you eat lamb, you're a monster anyway.
If you eat lamb, you're a monster anyway.
No comments:
Post a Comment